Lessons Learned From World Model Training for LLM Agent
In my previous post, I trained an LLM agent on Delta Lake tasks with GRPO and with ECHO. I compared how well each model predicts its tool outputs and how many tasks it solves. That post was already long, so I left out most of what happened on the way to those results. This post covers the problems I ran into, the training metrics that pointed to them, why I read them the way I did, and what I changed.
The setup, briefly:
- Policy: NVIDIA Nemotron 3 Nano 4B, non-thinking. It is a hybrid model that keeps most of its state in Mamba-2 layers and has four attention layers.
- Training: NeMo RL 0.7 on the Megatron backend, with vLLM as the sampler. GRPO with 8 prompts × 8 rollouts per step, for 90 steps.
- Arms: GRPO, ECHO with $\lambda=0.005$ and ECHO with $\lambda=0.02$, one seed each.
- Hardware: each arm ran on one H200 on Modal. A run took about 4 hours and cost about $23.
- Environment: a Databricks-style simulator built on Spark Connect and Delta Lake. The agent has three tools,
run_sql,run_pythonandsubmit, and a verifier checks the final state of the tables.
The code is at munhouiani/delta_world.
Before Training
Base Model Claims Success Without Acting
Base Nemotron could not do these tasks. When I asked it to restore a damaged table, it would query the table and then claim the job was done, without ever running RESTORE. In a pilot, it ran 2 RESTOREs in 48 attempts and solved about 5% of dev tasks, none in family A (time travel) or D (clustering). Here is an example of execution:
1 | Task: A test job ran an INSERT OVERWRITE against workspace.ops.invoices ... Restore the |
The verifier reads the table’s final state and ignores what the agent says it did, so this episode scores 0. That is what a verifier should do, but it left RL with nothing to learn from. When all 8 rollouts in a group fail, every advantage in the group is zero, and the group contributes no gradient.
I first tried few-shot examples of the agent loop in the system prompt. That made things worse: family C (schema evolution) fell from 0.15 to 0.02.
What worked was a light supervised fine-tune on verified episodes from a teacher model, Claude Haiku 5.5, trained on the assistant’s tokens only. The amount of data has a significant impact:
| Teacher episodes per family | Result |
|---|---|
| 10 | no better than the base model |
| 25 | a usable start, with every family except D above zero |
| 100 | 0.77 on dev, which leaves little room for RL to show anything |
I used 25 per family, which I call S0. It scores 0.240 on dev and is the starting point for all three arms.
Lesson: Don’t rush into RL. Check that your base model produces a learning signal and has room to improve.
Slow Simulator
A training step waits for all 64 episodes, so at first the simulator’s speed set the cost of the whole experiment. Delta commits took most of the time: a MERGE costs about 1s and a RESTORE about 2s. Setting up and verifying a task took 65% of an episode’s time. Under load, the Spark JVM was CPU-bound, because it compiled generated code for every new query plan.
I ended up turning off Spark’s code generation and using Hadoop’s raw local filesystem. One episode went from 8.3 s to 4.5 s, and throughput at 8 concurrent episodes rose from 0.26 to 0.58 episodes per second. These changes were meant to be invisible to the agent, but the reinforcement learning cycle runs faster (and saves me a lot of money).
Lesson: The bottleneck of an RL cycle might not be GPU training. Finding and fixing it saves a lot of money.
During Training
Every run logged about a hundred metrics to Weights & Biases at each step. The default dashboard shows reward and loss, and those were rarely where a problem showed first. These are the signals that told me something:
| Signal | Healthy | What I saw | What I did |
|---|---|---|---|
| Step-1 reward | close to S0’s pass@1 (0.240) | 0.27-0.33 | nothing |
| Worst sequence’s sampler/trainer probability ratio | about 1.01 | $10^{12}$ to $10^{24}$ on about half the early steps | stopped all arms, found the cause, relaunched |
| Groups where all 8 rollouts failed | falling | ECHO’s fell; GRPO’s fell, then rose | broke it down by family |
| The starting model’s habits | stable | GRPO’s submit share fell from 0.45 to 0.02 |
wrote down how to read the results |
| Policy entropy | flat or slowly falling | ECHO’s rose 2.3x and 3.2x; GRPO’s halved | watched |
| ECHO’s observation loss | falling as reward rises | fell while reward collapsed | read it next to truncation |
| Training reward | tracks the evaluation | matched overall, hid a lost family | evaluated by family at steps 30, 60 and 90 |
The First Step
Step 1 samples S0 on tasks from the same generators as the evaluation, so I expected its batch reward to land near S0’s pass@1 of 0.240. That only holds if the sampler settings match. NeMo RL’s default sampling temperature is 1.0 and my evaluation uses 0.6, so I set 0.6 before launch.
The three arms’ step-1 rewards were 0.27, 0.31 and 0.33. All three sample the same S0 on the same prompts at step 1, so their differences are sampling noise alone. A batch of 64 rollouts on only 8 prompts is close enough to 0.24, and I changed nothing. The point is to know what step 1 should show before launching, and to stop if it shows something else.
The Sampler and The Trainer Disagreed
In NeMo RL, vLLM samples the rollouts and Megatron computes the gradients, both from the same weights. The update treats the sampled tokens as if Megatron had sampled them, so if the two engines disagree, every update is off-policy. NeMo RL logs the disagreement as the generation KL error, and as max_seq_mult_prob_error, the probability ratio of the worst sequence in the batch. When the engines agree, the KL error is about 3e-4 and the worst ratio about 1.01.
At the first launch, both metrics spiked on about half of the early steps, in every arm, GRPO included. The KL error reached 0.005-0.056, and the worst sequence’s ratio reached $10^{12}$ to $10^{24}$.
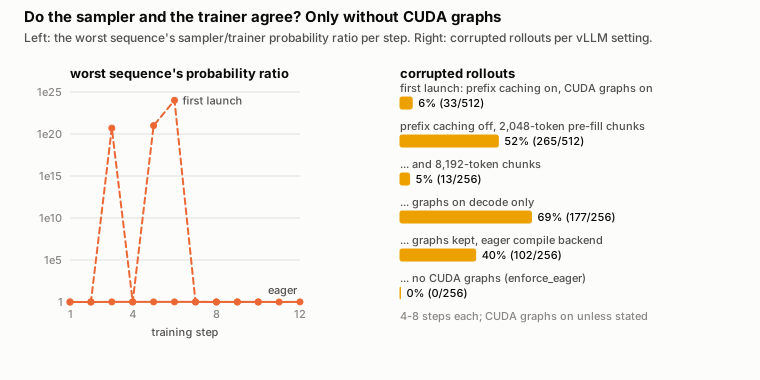
A few sequences carried each spike. In the per-step sample dumps, their generation turned to garbage right after a tool result:
1 | " A Find E проекта E 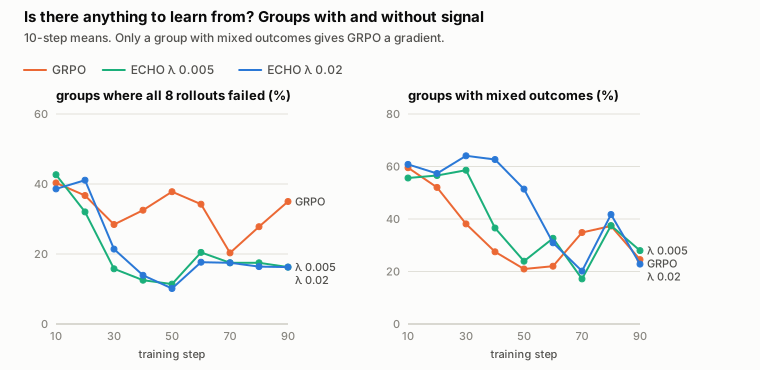
The ECHO arms followed that path, from 39-43% of groups over steps 1-10 to 10-21% from step 21 on. GRPO’s fell to 28% over steps 21-30, then rose again and ended at 35%. Groups with mixed outcomes were common from the start: 50-72% at step 1.
I learned three things from this. First, GRPO had a learning signal from step 1. That is not the sparse-reward setting that motivates ECHO, where most groups fail and the observation loss becomes the main teacher. Second, GRPO’s late rise came from a family it had lost, not from tasks it never learned. When I broke the share down by family, using NeMo RL’s per-sample logs, GRPO’s family-E groups failed outright in every batch I sampled from step 30 to step 60. The batch mean doesn’t show that. Third, the ECHO arms’ all-fail share settled at 16-20% from step 51. That floor is close to the share of training prompts that no model ever solved.
Lesson: Understand the RL algorithm.
After Training: Tasks No Model Learned
After training, I checked the instances that no model ever solved: 16 on dev and 28 on test-ood-hard, unsolved in 16 samples across S0 and the three step-90 arms. My first worry was broken tasks, but the scripted solver solves all 44. Most of them belong to two kinds of task that no model learned, before or after training:
| Kind | Solved, dev | Solved, test-ood-hard | What the models do | The step no model takes |
|---|---|---|---|---|
C, a column widened from INT to BIGINT |
0/20 | 0/40 | ALTER COLUMN value TYPE BIGINT, which is rejected |
enable delta.enableTypeWidening first |
| D, clustered on the wrong column | 1/48 for $\lambda=0.02$, 0/48 for the rest | 0/44 | CLUSTER BY the filtered column, then a plain OPTIMIZE, which reclusters nothing |
OPTIMIZE ... FULL |
Their neighbours were learned. Renamed columns went from 2 of 32 for S0 to 27-30 of 32 for the trained arms, and unclustered tables went from 1 of 48 to 41-47 of 48. Each of the two failing kinds needs one Delta feature that the models almost never used. The environment gives no hint, just as Databricks doesn’t: the rejected ALTER returns the workspace’s own message, “ALTER TABLE CHANGE COLUMN is not supported for changing column value from INT to BIGINT”, which doesn’t mention type widening.
Neither loss can reach these tasks. A group whose 8 rollouts all fail gives GRPO no gradient. ECHO’s observation loss can’t help either: the missing step almost never runs, so its output is almost never there to be predicted. These tasks are 16.4% of the training prompts, and they cap every arm at about 0.86 on dev and 0.82 on test-ood-hard.
Lesson: Understand the failure and design a better guide for the model.
What I Would Put On the Dashboard From The Start
If I ran this again, these are the panels I would set up before step 1, in order:
- Step-1 reward against the starting model’s evaluation.
- The worst sequence’s sampler/trainer probability ratio, and a count of corrupted rollouts from the sample dumps.
- The share of groups where every rollout failed, per family.
- The starting model’s habits in the training batches: how episodes end, and the commands that decide each family.
- Policy entropy and generated length.
- Any auxiliary loss, next to reward and the truncation rate.
- Step time split into rollout and training, the number of episodes vLLM is generating through the rollout, and environment errors.
- A held-out evaluation every 30 steps, broken down by family.
Reward and loss alone would have missed most of the problems in this post.